Introduction
In a previous post I wrote a script to transform strings dynamically constructed out of packed long words into the full, readable string.
I did this by implementing a forward pass over the raw pcode, observing COPY operations where the source was packed ascii, finding STORE operations that used this value, merging the substrings, and patching the code to strcpy the full string into the destination.
This worked fairly well but the code was really gross. For one, I didn't know about Ghidra's PcodeOpAST/VarnodeAST SSA API at the time. But even then, the procedure just seems kind of gross and not very general.
Therefore, I had the idea of emulation the code to automatically get the string values. No special program analysis needed. This is true but as we'll see later, to implement the full transformation is not so simple. But I'm a big fan of emulating pcode in Ghidra so I prefer this method.
Basic Blocks
Let's look at function that we want to transform:
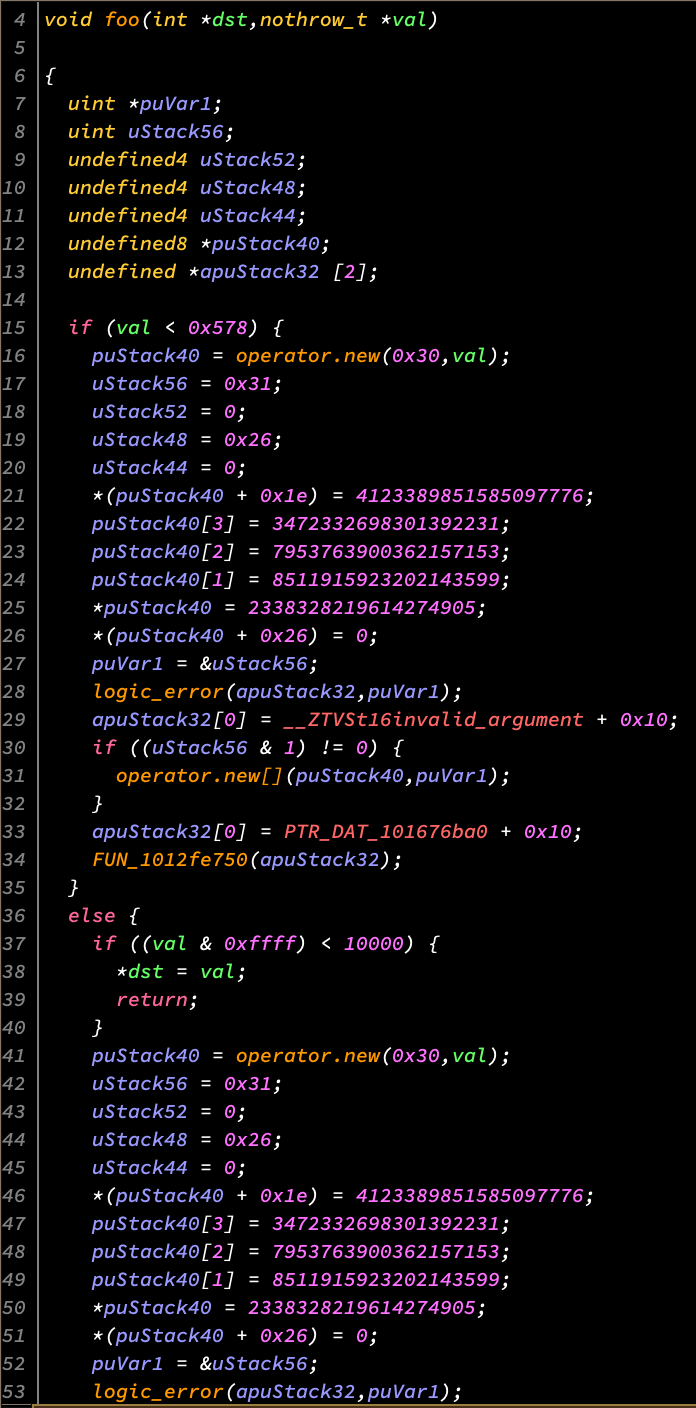
Immediately we run into a problem. We can't just emulate the function from beginning to end since there are many possible execution paths depending on the values of the parameters. For example, if val is at least 1400 (0x578) and less than 10000, then the function never contructs the string and it will not be in the emulator's memory.
Thankfully, it appears that strings are constructed with a series of contiguous instructions. In other words, they are constructed within a single basic block. Of course, this isn't guaranteed but it seems like a fairly safe assumption to make.
Therefore, we can emulate every basic block of the function individually to get the full strings.
As far as I can tell, there is no function in the Ghidra API that gets all the basic blocks for a function so we'll have to implement that ourselves:
from ghidra.program.model.block import BasicBlockModel

def getBasicBlocks(func):
    bbm = BasicBlockModel(currentProgram)
    buf = bbm.getCodeBlocksContaining(func.entryPoint, TaskMonitor.DUMMY)
    blocks = []

    # Do BFS on the entrypoint basic block(s).
    while len(buf) > 0:
        block = buf.pop(0)

        if block not in blocks and getFunctionContaining(block.minAddress) == func:
            blocks.append(block)

            iter = block.getDestinations(TaskMonitor.DUMMY)

            while iter.hasNext():
                buf.append(iter.next().destinationBlock)

    return blocks
Emulation
Let's now design an API to emulate the basic blocks.
Something like this seems reasonable:
cpuState = emulate(block.minAddress, # from
                   block.maxAddress) # to
Our emulate function will return an object representing the resulting CPU state that we can read registers/memory from.
Now let's write emulate's implementation:
def emulate(startAddr, endAddr):
    emu = Emulator()
    emu.set_pc(startAddr)
    emu.set_sp(0xf0000000)

    prev_pc = None

    while emu.get_pc() != endAddr.offset and emu.get_pc() != prev_pc:
        prev_pc = emu.get_pc()
        emu.step()

    return emu
First, we'll create an Emulator object to wrap Ghidra's EmulatorHelper. This isn't strictly necessary but I don't really like the EmulatorHelper interface so I usually prefer to write my own.
Then we'll simply step the emulator until endAddr is hit or the current PC equals the previous PC, i.e. the emulator has hit an infinite loop.
One caveat is that we first have to do a small fixup to endAddr because of the way Ghidra's AddressSets work. Since the bounds are inclusive block.maxAddress will return the address of the last byte of the last instruction of the block. If we left endAddr unmodified, our emulation loop would never terminate because endAddr does not point to the beginning of the last instruction of the block.
Therefore, we'll slightly adjust it:
    if getInstructionAt(endAddr) is None:
        endAddr = getInstructionBefore(endAddr).address
If we try running this, we'll see that it never terminates. Why?
We can make the emulator output a trace to see what's happening:
10133f5a0
10133f5a7
10133f5a9
10133f598
1013413d8
1013413dd
10133f5a0
We see that there's an infinite loop longer than one instruction. If we look up these addresses in the binary, we see that control flow is jumping between some __stub_helper -> __stubs::dyld_stub_binder -> __stub_helper::dyld_stub_binder -> some __stub_helper. It seems that we're trying to call a dynamically linked function which has not yet been resolved.
If go to the beginning of the trace to find the last instruction executed in our target function, we see it's call FUN_1012fe750. We could put in a check in our emulator loop to skip over this specific call but let's instead an option in our emulate interface to skip calls.
So our new interface will look like:
cpuState = emulate(block.minAddress, # from
                   block.maxAddress, # to
                   skip_calls=True)
Now let's look at our Emulator wrapper class and its implementation of step:
class Emulator(object):
    def __init__(self):
        self.emu = EmulatorHelper(currentProgram)
        self.pc_reg = self.emu.getPCRegister()
        self.sp_reg = self.emu.getStackPointerRegister()

    def get_pc(self):
        return self.emu.readRegister(self.pc_reg)

    def set_pc(self, val):
        if isinstance(val, Address):
            val = val.offset
        self.emu.writeRegister(self.pc_reg, val)

    def get_pc(self):
        return self.emu.readRegister(self.sp_reg)

    def set_sp(self, val):
        if isinstance(val, Address):
            val = val.offset
        self.emu.writeRegister(self.sp_reg, val)

    def step(self, skip_calls):
        pc = toAddr(self.get_pc())
        insn = getInstructionAt(pc)

        if skip_calls and insn.flowType.isCall():
            new_pc = pc.add(insn.length)
            self.set_pc(new_pc)
            return

        prev_pc = pc
        self.emu.step(TaskMonitor.DUMMY)
Now we should be able to emulate all of the basic blocks of our function:
def getStackStrings():
    func = getFunctionContaining(currentAddress)
    blocks = getBasicBlocks(func)

    for block in blocks:
        print('Emulating block %s - %s' % (block.minAddress, block.maxAddress))

        cpuState = emulate(block.minAddress,
                           block.maxAddress,
                           skip_calls=True)
and we can validate that we successfully emulate all the blocks:
Emulating block 1012fe590 - 1012fe5a0
Emulating block 1012fe5b9 - 1012fe63c
Emulating block 1012fe5a1 - 1012fe5ae
Emulating block 1012fe646 - 1012fe662
Emulating block 1012fe63d - 1012fe645
Emulating block 1012fe663 - 1012fe6e6
Emulating block 1012fe5af - 1012fe5b8
Emulating block 1012fe708 - 1012fe709
Emulating block 1012fe6f0 - 1012fe707
Emulating block 1012fe6e7 - 1012fe6ef
Watchpoints
We could now pull out the strings from the CPU state directly but we need to know which instructions construct the string. Therefore we need watchpoints. Here's the plan:
1. Keep track of all calls to `operator.new`.
2. Observe all writes to the allocated buffers.
3. Emulate the basic block.
4. Patch the instructions that wrote strings to the allocated buffers.
So first we need to implement support for hooking a function call.
We change our call to emulate to look something like this:
cpuState = emulate(block.minAddress,
                   block.maxAddress,
                   hooks={func.entryPoint: malloc for func in getGlobalFunctions('operator.new')},
                   skip_calls=True)
where we will define malloc to be the code we want to run when operator.new is called.
We then need to change our emulator loop so that every time a function is about to be called (or skipped in our case), if the destination is in our hooks dict, we run the corresponding handler code.
def emulate(startAddr, endAddr, hooks=None, skip_calls=False):
    ...

    while emu.get_pc() != endAddr.offset and emu.get_pc() != prev_pc:
        pc = toAddr(emu.get_pc())

        for ref in getReferencesFrom(pc):
            if ref.referenceType.isCall() and ref.toAddress in hooks:
                dest = ref.toAddress
                call_hook(dest, hooks[dest], emu)

        prev_pc = pc.offset
        emu.step(skip_calls)

    ...
We define a separate call_hook function so that we can pass our handler code the parameters passed to operator.new:
def call_hook(pc, handler, emu):
    func = getFunctionAt(pc)
    args = [emu.readVar(param) for param in func.parameters]

    retval = handler(emu, *args)

    if retval is not None and func.getReturn() is not None:
        emu.writeVar(func.getReturn(), retval)
Here we assume that we've defined the function signature for the function we want to hook in Ghidra so that we can inspect the input locations of the function using function.parameters as well as the output using func.getReturn().
We can then add the readVar and writeVar methods to our Emulator class:
class Emulator(object)
    ...

    def readVar(self, var):
        if var.isStackVariable():
            stackOff = var.getStackOfset()
            return self.emu.readStackValue(stackOff, var.length, False)

        elif var.isRegisterVariable():
            reg = var.getRegister()
            return self.emu.readRegister(reg)

        else:
            throw NotImplementedError('Emulator.readVar not supported for Variable %s' % var)

    def writeVar(self, var, val):
        if var.isStackVariable():
            stackOff = var.getStackOfset()
            return self.emu.writeStackValue(stackOff, var.length, val)

        elif var.isRegisterVariable():
            reg = var.getRegister()
            return self.emu.writeRegister(reg, val)

        else:
            throw NotImplementedError('Emulator.writeVar not supported for Variable %s' % var)
We can finally write our malloc hook to "allocate" a buffer and
    def malloc(emu, size, *args):
        ptr = heap.alloc(size)
        addr = toAddr(ptr)

        if size > 0:
            bufs.append(Buffer(addr, size))
            emu.watch(addr, size, handler=handle_write)

        return ptr
We use a simple bump allocator for our heap object (take a look at the code in the repo if you're curious, there's already too many code snippets in here and there are more on the way).
The important thing to note is that we keep track of the allocated buffers and have the emulator watch for any writes to them.
To actually implement the watchpoints, we can use the EmulatorHelper's trackedMemoryWriteSet feature. However, this property keep track of all the varnodes that have been written to since the emulation begin -- not the varnodes written on the previously emulated instruction.
What we can do to work around this is keep track of the previous write set and subtract it from the current trackedMemoryWriteSet. However this is still not ideal since that means we can only trigger a watchpoint for an address once (after it's written the first time, it will always be subtracted from the current write set).
This is ok, however, for our purposes since we only expect our allocated strings to be written to once.
Using this assumption to simplify things even further, we can just use the full write set and remove watchpoints immediately after they're triggered.
Here's our new Emulator implementation:
class Emulator(object):
    def __init__(self):
        ...
        self.emu.enableMemoryWriteTracking(True)

    def step(self, skip_calls):
        ...
        self.emu.step(TaskMonitor.DUMMY)

        for addrSet in self.emu.trackedMemoryWriteSet:
            size = addrSet.maxAddress.subtract(addrSet.minAddress)

            if addrSet.minAddress.isMemoryAddress() and size > 0:
                calledHandles = []

                for addr, handler in self.watchpoints.items():
                    if addr >= addrSet.minAddress and addr <= addrSet.maxAddress:
                        val = self.read(addr, 1)
                        handler(addr, 1, val, prev_pc.offset, emu=self)
                        calledHandles.append(addr)

                for addr in calledHandles:
                    del self.watchpoints[addr]
Finally, we need to implement our handle_write watchpoint hook to update the keep track of where the string is being written to ((register, offset) pair like in the previous tutorial) as well the instructions that being used to construct the string.
I just realized that since we're only keeping tracked of malloced buffers, the register will always be RAX but I'll keep it this way since I'm lazy and this also makes it more easily extensible to actual stack strings.
Anyways, our watchpoint hook will basically update these parameters for every buffer we're keeping track of:
def handle_write(addr, size, val, pc, emu=None):
    for buf in bufs:
        if buf.start <= addr and addr <= buf.end:
            buf.write_start = min(buf.write_start, pc)
            buf.write_end   = max(buf.write_end  , pc)

            insn = getInstructionAt(toAddr(pc))

            for i in range(insn.numOperands):
                if insn.getOperandRefType(i).isWrite():
                    objs = insn.getOpObjects(i)

                    for obj in objs:
                        if isinstance(obj, Register):
                            buf.reg = obj
                        elif isinstance(obj, Scalar):
                            buf.off = min(buf.off, obj.unsignedValue)
Putting it All Together
We can now finally pull out all the stack strings that our emulated basic blocks constructed:
for block in blocks:
    bufs = []

    ... # emulate

    for buf in bufs:
        try:
            contents = cpuState.read(buf.start, buf.size).decode('utf-8')
        except UnicodeDecodeError:
            continue

        for i, b in enumerate(contents):
            if b == u'\x00':
                stackString = StackString(contents[:i+1], buf.reg, buf.off, buf.write_start, buf.write_end)
                stackStrings.append(stackString)

            if b not in string.printable:
                break
This procedure is similar to before, if the buffer's contents is decodable as null-terminated utf-8, we log it as a stack string to patch.
Aside: The Patch
As I mentioned in the previous post, the patch we were using was pretty long. For reference, this is what is was:
    push rsi            ; save all the registers we're going to use
    push rdi
    push rax
    lea rsi, [0x9] ---  ; get our string address into the source register
--- jmp strlen + 2   |  ; jump over the string
|   s            <----
|   t
|   a
|   c
|   k
|
|   s
|   t
|   r
|   i
|   n
|   g
|   \x00
--> lea rdi, [reg + off]  ; get our register + offset into the destination register
    call strcpy           ; call strcpy
    pop rax               ; restore the registers we used
    pop rdi
    pop rsi
I found a slightly more space-efficient way to jump over the string and get the string address into RSI: call the destination block then pop RSI. When the CALL is executed, the "next PC" (the address of the string) will be pushed onto the stack. Then we can just pop this address into RSI.
Here is the new patch for reference (using a shitty macro assembler language I hacked together):
push rdi
push rsi
push rax

call ${strlen_plus_5}
${str}
pop rsi

@if (off == 0)

@if (reg.lower() != 'rax')
push reg
@endif

pop rdi

@else
lea rdi, [${reg} + ${off}]
@endif

call ${strcpy}

@if (off != 0 or reg.lower() != 'rax')
pop rax
@endif

pop rsi
pop rdi
Conclusion
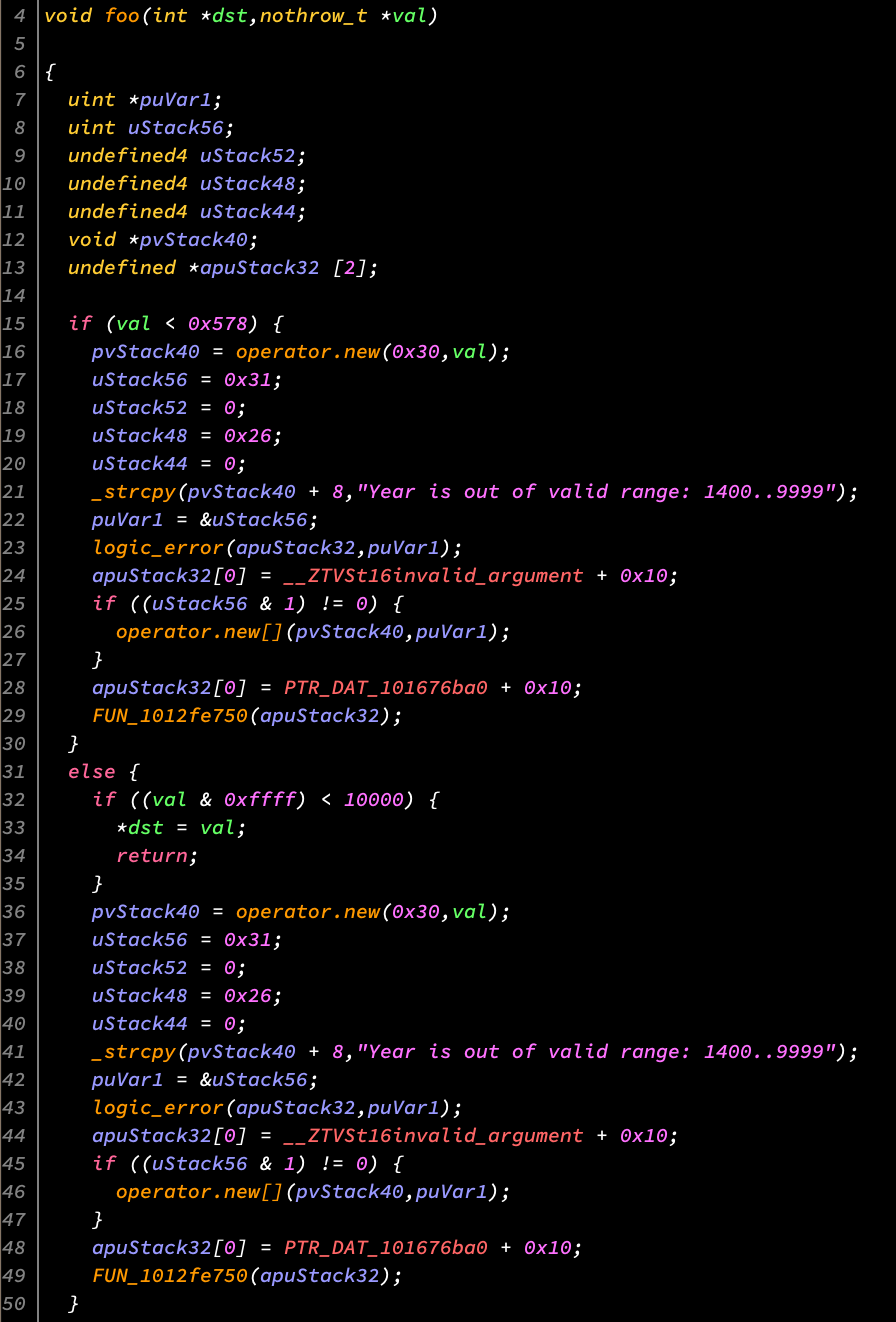
As we can see, the script works the same as before, getting these strings to display nicely in the decompiler:
This was as usual largely a pointless exercise but the code is cleaner now (imo) and I realized there aren't many tutorials out there on how to use Ghidra's emulator. Here's the code and thanks for reading.