I don't really know how to reverse engineer iOS apps. I don't know about tracing network calls, system calls, or whatever. What I do know is that when I tap a button, eventually something that I care about happens.
For example, this post is once again brought to you by Spotify. I get mad that every time I want to a) search a song and b) play that song right away, if I select the search result directly, my playing context will switch to the search results. That is if I search "Music" and play "Music" by Peven Everett, the next song played might be "Listen to the Music" by The Doobie Brothers rather than the next song in the shuffle. What I want to happen is the song to play and once finished, return to the previous context.
Finding the TableView Cell
In order to observe the different effects of playing a song when searching and not searching, we first need to find a trigger on when to start tracing method calls. Knowing a little bit of iOS programming, we know that (assuming Spotify isn't doing anything too custom) the song should displayed with a subclass of UITableViewCell and that should contain a label (subclassed from UILabel) that constains the song name.
So with Frida, the first thing we can do is get the entire view hierarchy. That is, just get an array of all views displayed.
This can be done with BFS on the key window:
var get_all_views = function() {
    var root = ObjC.classes.UIWindow.keyWindow(); // The root of the view hierarchy
    var buff = [root];                            // The views left to traverse
    var visited = [];                             // The views we have already traversed

    while (buff.length > 0) {
        var node = buff.shift();

        // Make sure we don't traverse a view twice
        if (visited.indexOf(node) >= 0)
            continue;

        visited.push(node);

        // Iterate over all the view's subviews
        var children = node.subviews();

        for (var i=0; i<children.count(); i++) {
            var child = children['- objectAtIndex:'](i);

            if (visited.indexOf(child) == -1)
                buff.push(child);
        }
    }

    return visited;
}
We can then get all of the UILabel's (presumably) with the following:
labels = views.filter(function(v) { return v.$className.indexOf('Label') >= 0; });
We can get the whole view hierarchy for just the chosen label (the one with a song name in it). I'll refer to this as the view's stack. Note that this isn't really a stack but whatever.
var get_view_stack = function(view) {
    var stack = [];

    while (view.superview() != null) {
        stack.push(view);
        view = view.superview();
    }

    return stack;
}
Finally, we can print out the label view's stack to get the class of the table view:
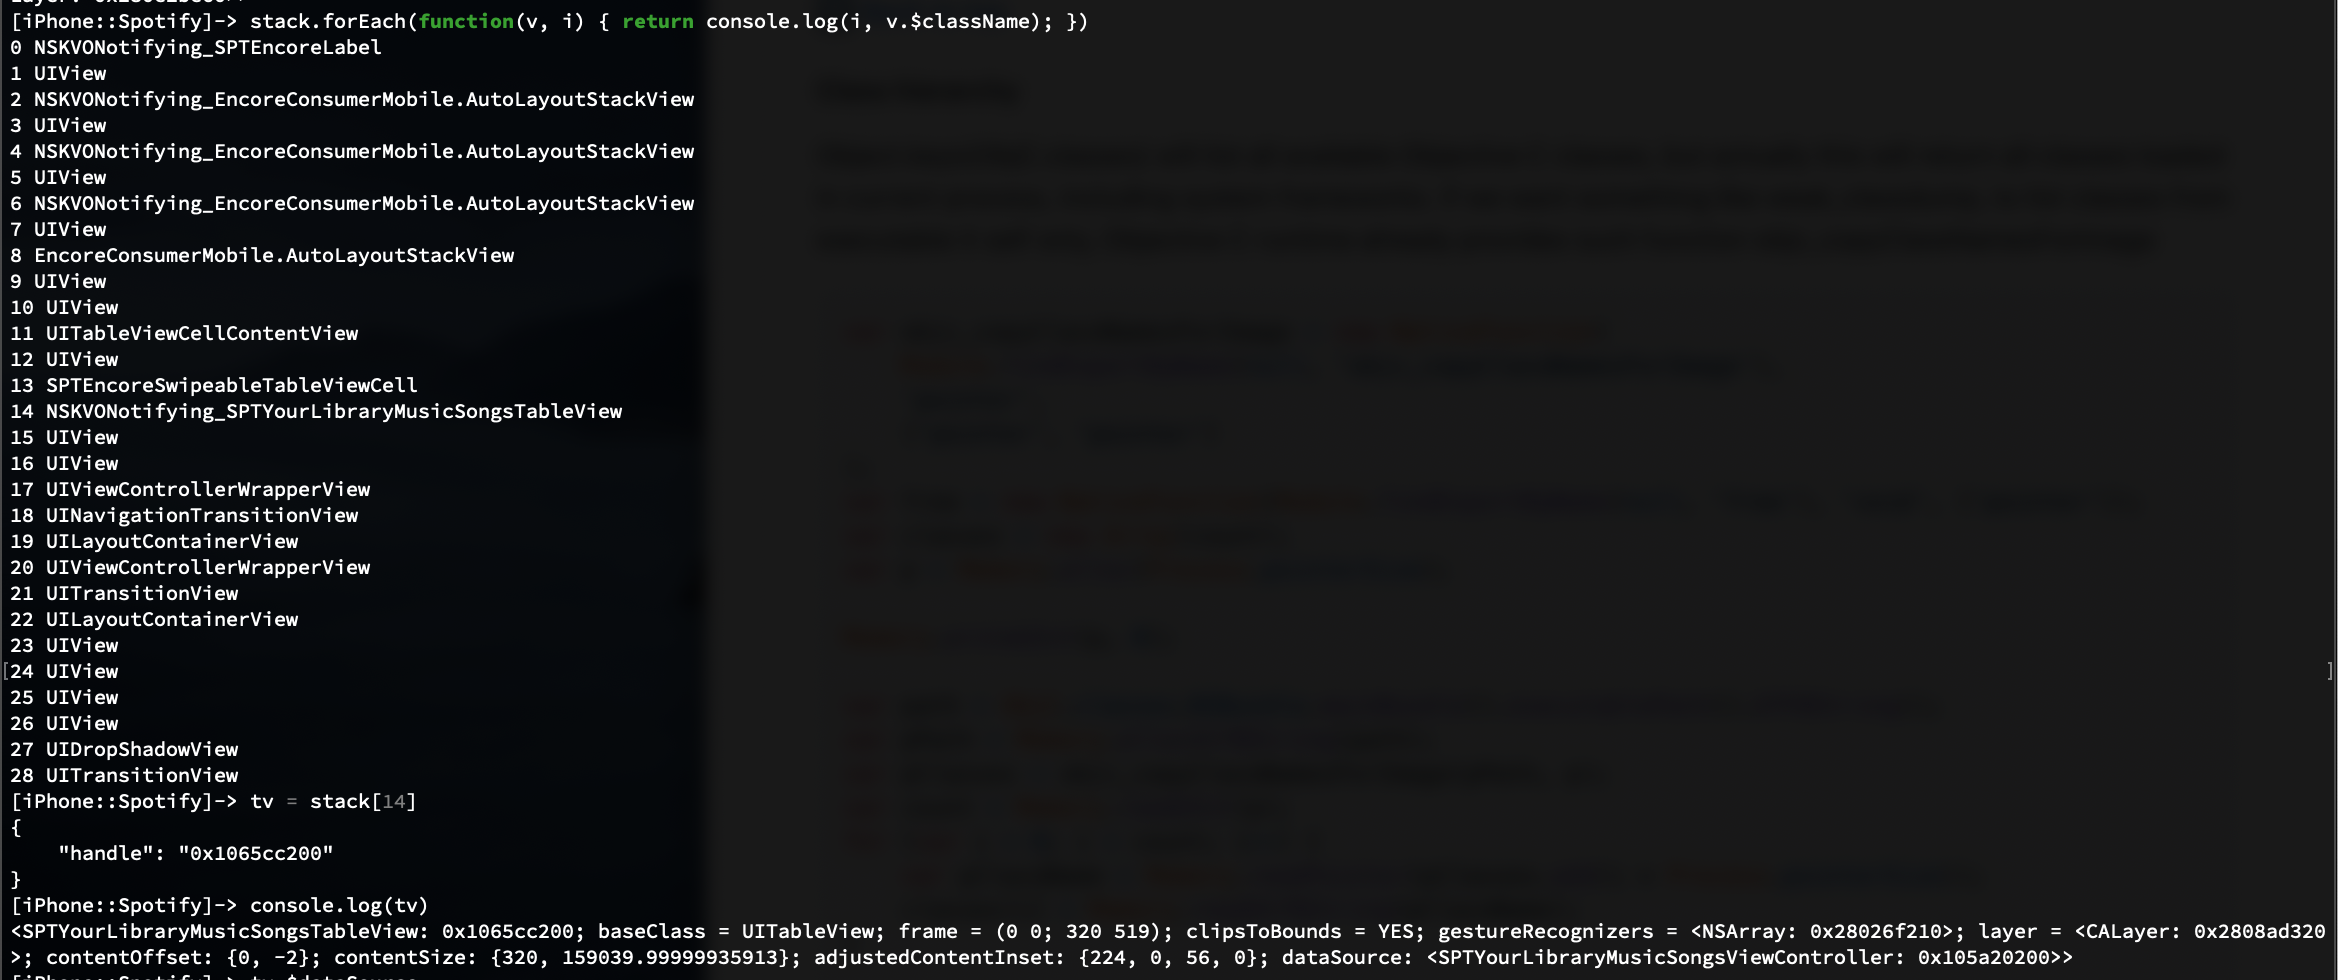
Again, using our knowledge of iOS programming and assuming that Spotify isn't doing anything weird, we assume that the SPTYourLibraryMusicSongsViewController class is the table view cell's delegate and therefore has a - tableView:didSelectRowAtIndexPath: that will be called when tapped.
Tracing the Tap
Know that we've found the method we want to trace, we need to actually trace it with Frida. This is surprisingly simple using Frida Stalker.
First, we need to calculate the ASLR slide:
var impl = ObjC.classes.SPTYourLibraryMusicSongsViewController['- tableView:didSelectRowAtIndexPath:'].implementation;
var slide = parseInt(impl) - 0x102ef6040;
where 0x102ef6040 is the static imp pointer for the delegate method obtained from the Objective-C metadata.
What we'll do is start stalking the current thread when the delegate method is called:
Interceptor.attach(impl, {
    onEnter: function(args) {
        console.log('Hit trigger');

        var tid = Process.getCurrentThreadId();
        console.log('Stalking thread ' + tid);

        Stalker.follow(tid, {
            events: {
                call: true,
                ret: false,
                exec: false,
                block: false,
                compile: false,
            },
where only call is true in the Stalker arguments since we only care about which methods are called, not the individual instructions being executed.
We then need to parse each Stalker events. I don't want to go through the methodology here, but I started by printing the call summaries (which address and number of times called), but I got that none of the actual class imps were being called but a function at 0x102f2432c was being called more than any other function. Sure enough that points to objc_msgSend, the dispatch function for every (well, most) Objective-C method calls. So what we want to do is actually print out the id's and selectors being passed to objc_msgSend. However, I couldn't figure out how to do that with Frida, so I ended up printing out the calling address to objc_msgSend. I figured you could later just disassemble at that address to get the method called.
            onReceive: function(events) {
                // Parse the events
                var events_ = Stalker.parse(events, {
                    stringify: true
                });

                events_.forEach(function(ev) {
                    // Unslide the call target
                    var target = parseInt(ev[2]) - slide;

                    // objc_msgSend was called
                    if (target === 0x102f2432c) {
                        // Print the unslid calling address
                        var calling_addr = parseInt(ev[1]) - slide;
                        console.log(calling_addr.toString(16));
                    }
                });
            }
Sybmolicating the Log
We now get a long list of addresses which have a bl(x) objc_msgSend instruction:
102ef6088
101898648
10189865c
101898678
102ef60a4
102ef60c0
102ef60d4
102ef60f0
...
and would at least like to see which method contained the method call.
To do that, we'll create a map of imp pointers to method names (class name + selector). But to create that, we first need to be able to parse the Objective-C class metadata into a well-formatted data structure.
I previously had some scripts to do this in radare, but since radare sucks, I converted it into a Ghidra script which can be found here.
This will give you a file named classes.json structured as:
<class name>: {
    methods: {
        <selector>: <imp pointer>,
        ...
    },
    ivars: {
        <name>: <type>,
        ...
    }
}
we can then reverse this map like so:
imp_map = {}

for cname, klass in classes.items():
    for sel, imp in klass['methods'].items():
        imp_map[imp] = cname + '.' + sel
to get our desired mapping.
We can then do a binary search on the keys of this map to find out the method that each call site resides in (don't judge me if the bsearch isn't canon):
def bsearch(addr, imp_addrs):
    i, j = 1, len(imp_addrs)

    while (j - i) > 1:
        m = (i + j) // 2

        if addr > imp_addrs[m]:
            i = m
        else:
            j = m

    return imp_addrs[i]

imp_addrs = sorted([int(k) for k in imps.keys()])

for addr in calling_addrs:
    func = bsearch(addr, imp_addrs)
    func_name = imps.get(str(func), '')
    print(hex(addr), hex(func), func_name)
and our log is magically converted into
0x102ef6088 0x102ef6040 SPTYourLibraryMusicSongsViewController.tableView:didSelectRowAtIndexPath:
0x101898648 0x101898620 SPTSwipeableTableViewCell.setSelected:animated:
0x10189865c 0x101898620 SPTSwipeableTableViewCell.setSelected:animated:
0x101898678 0x101898620 SPTSwipeableTableViewCell.setSelected:animated:
0x102ef60a4 0x102ef6040 SPTYourLibraryMusicSongsViewController.tableView:didSelectRowAtIndexPath:
0x102ef60c0 0x102ef6040 SPTYourLibraryMusicSongsViewController.tableView:didSelectRowAtIndexPath:
0x102ef60d4 0x102ef6040 SPTYourLibraryMusicSongsViewController.tableView:didSelectRowAtIndexPath:
0x102ef60f0 0x102ef6040 SPTYourLibraryMusicSongsViewController.tableView:didSelectRowAtIndexPath:
...
which seems reasonable. Unfortunately, we still have to a) figure out which method(s) diverge in the traces of a normal tap and a tap while in search mode and b) manually disassemble/decompile interesting methods in the trace to recover the full control flow since all we get are callsites -- not called methods for free.
Conclusion
I got bored with manually sifting through the log and manually analyzing each interesting method so I didn't really achieve what I wanted to with this. Regardless, I thought there were some useful tidbits in here that someone might find useful some day. Enjoy.